I know inflation has been top-of-mind for a lot of people. But as I mentioned in the first post, inflation as a single number is very misleading. People's lives are affected by the change in daily expenses in complex ways.
One specific way is through housing. In fact, it has become a norm that about 1/3 of your income goes towards housing. You can find so many calculators and advice centered around this norm.
You can seach and play with a few to get a feel:
See how far your homebuying budget could take you. Enter your income, monthly debt payments, and available cash for a down payment into our home affordability calculator, and we’ll crunch the numbers for you.

www.nerdwallet.com
CNBC Select outlines several strategies to determine how much you can afford in monthly mortgage payments.

www.cnbc.com
(The following is specifically for rents)
https://www.zillow.com/rent-affordability-calculator/
But this is the main norm I want to challenge in this thread. My contention is that the norm should be like
Moore's Law, Wright's Law, or
Carlson Curve if we are to say that society is itself making progress. Once again, these norms based on a set of observations with a group of people collectively dreaming and putting together organizations to make and keep that norm a reality. See again
Moore's Second Law, the
roadmap for semiconductors, the
National Human Genome Research Group Institute. These are norms and expectations with groups working to continually keep their industry vibrant and dynamic by staying in
the sweet spot of the learning curves inherent in their work.
These exponentials are neither accidents nor laws of nature. They are held through tremendous collective effort and established norms.
Back to housing: From a progress in society perspective, I think the metric should be how much of a person's income is spent on housing, and I am arguing once again that this should be on an exponential decrease and not a 1/3 as is the supposed norm, but is actually exponentially increasing instead.
We can look at home prices divided by annual income as a guide. Here is one set of charts:
Historically, an average house in the US cost around 5 times the yearly household income. The ratio in this chart divides the Case-Shiller Home Price Index by the US median annual household income.

www.longtermtrends.net
If you look at the US chart from about 1954 to 1999, you can actually see a nice steady decline from about 6.5 to a little about 4.3. This was around the time I had a lot of acquaintances that were learning to become super-savers and there were many pushing to only get a house 3 times their annual income, and pay it off aggressively in 5 years. These days even if you pay off your home, property taxes alone could require ridiculous amounts just to stay in your home.
The subsequent period, in about half the time, saw an increase from 4.3 to about 8 right now. This is society going in the wrong direction. Remember this isn't just house as an asset (though it a large contributor the phenomenon), this is housing measured in
years worked with no other expenditures. This is access to a self-secured human right as measure of human life to achieve it.
For some people reading this, they may even be gleeful that that number had gone up as a means of their own "wealth" going up.
Imagine if we treated water that way? Access to basic human rights (and securing those rights through ownership) are being denied in favor of another "number goes up" collective
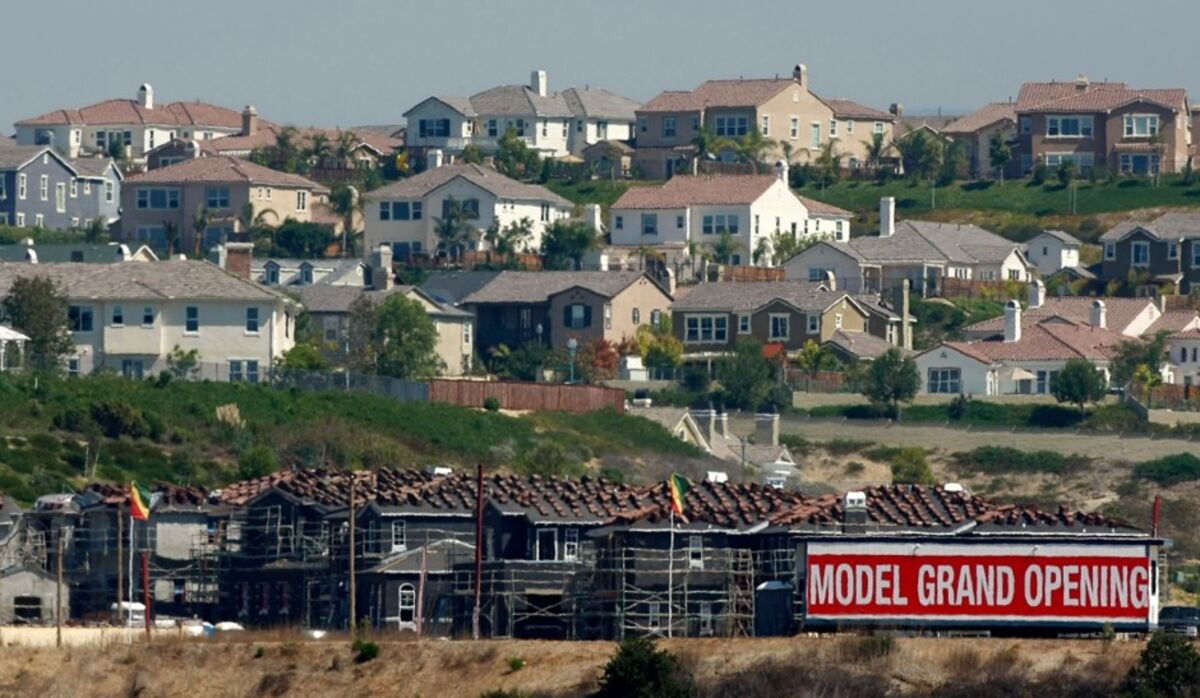
seeking of economic rents using local local lobbying of zoning boards and NIMBYism.
 www.bloomberg.com

 www.anthropocenemagazine.org
