It turns out I found some
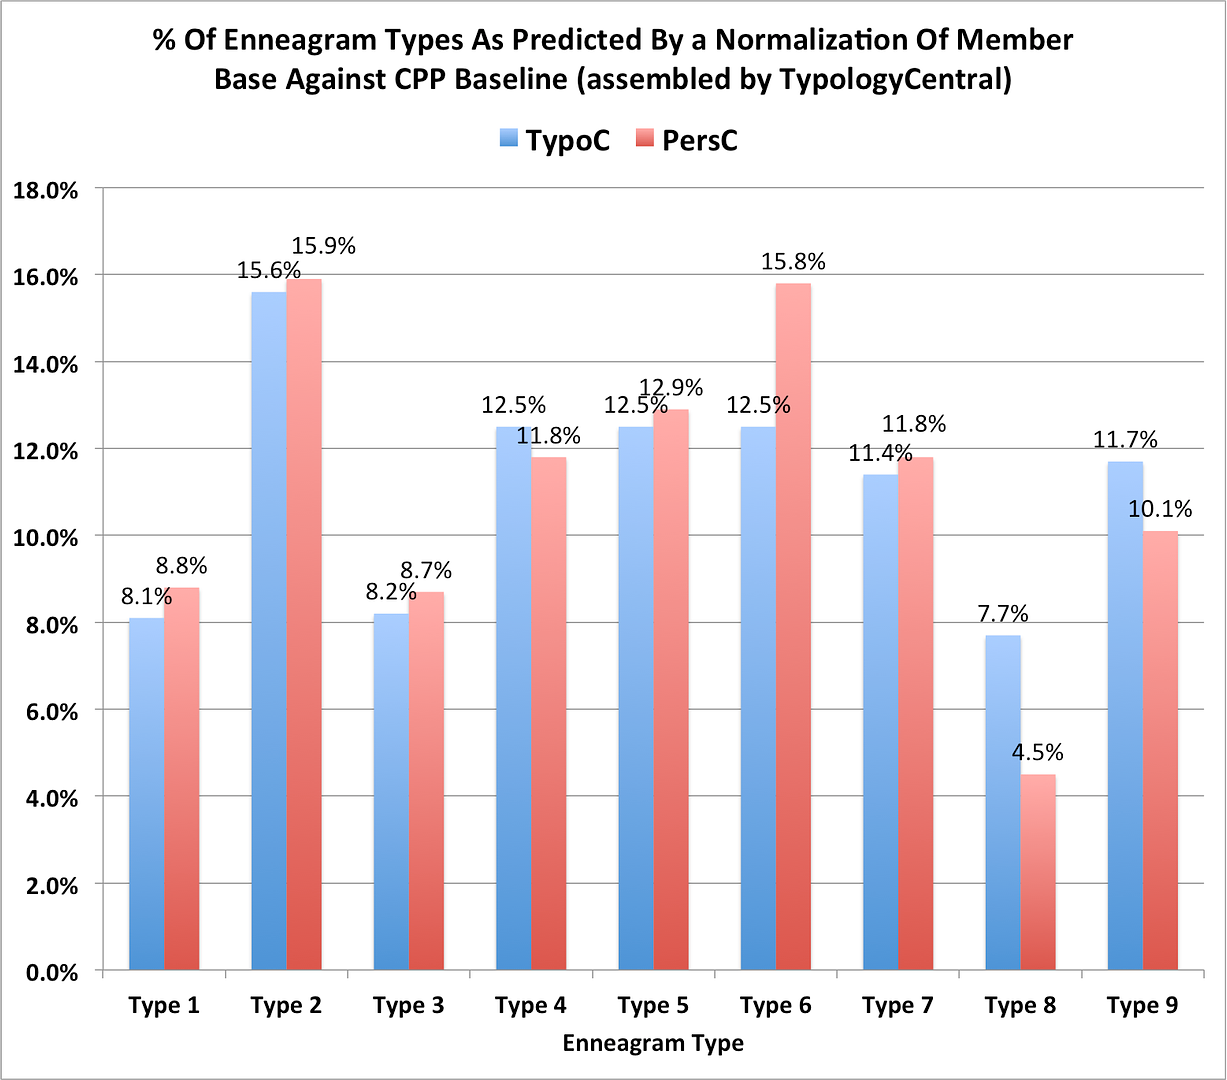
PersonalityCafe data that was out there from last year where some similar number crunching was done. I ran the same spreadsheet against it. The results come out very similarly in many ways with some differences. I was particularly interested in the types with smaller numbers (ESFJ, ESTJ). First on the overall Enneagram distribution, it looks pretty similar except there are a lot less 8s and more 6s on PersonalityCafe.
NOTE, THIS IS BASED ON THE NORMALIZED DISTRIBUTION.
Some key data points.
INFP - More 2s and 5s vs 4s (but still a large majority of 4s).
ENFJ - Fewer 3s and 4s with the percentages split roughly across other types (except for 2 which is the same)
INFJ - Twice the number of 2s, a lot less 4s and higher percentage of 5 and 6
ENTP - Half the number of 8s with the rest spread across mostly 3 and 5
INTP - Fewer 5s and twice the number of 6s
INTJ - Four times the number of 6s which were 20% of all INTJs and 40% more 1s (14%).
ENTJ - A lot more 6s and a fair number more 3s and about 35% fewer 8s
ESTJ - A lot more 6s and fewer 3s and 8s
ESFJ - 50% fewer 2s (though still the highest) and 3s with the rest spread across other types
ISFP - Triple the number of 2s; numbers generally more spread out
ESTP - A lot fewer 8s
As the the normalized distribution, here it is. On the makeup of the Enneagram types, or the general themes I mentioned, while there are some significant changes in some of the individual percentages, the overall themes seem consistent.
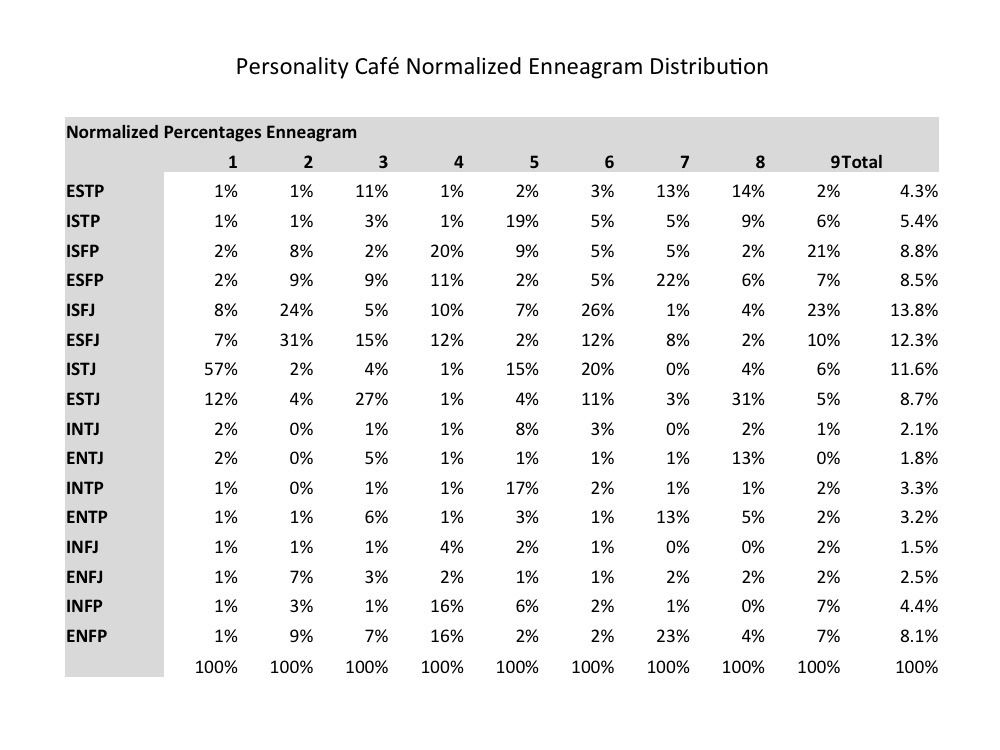
The numbers for ESFJ and ESFP seemed potentially more aligned with reality due to larger sample size.


") And typed myself as 9w1 for a long time.)
And typed myself as 9w1 for a long time.)