ygolo
My termites win
- Joined
- Aug 6, 2007
- Messages
- 6,735
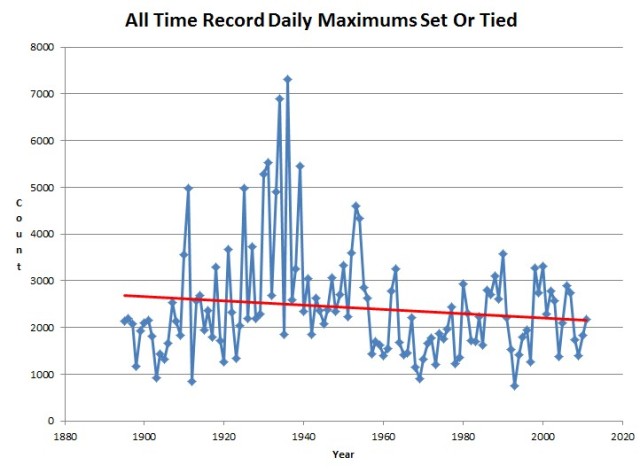
CO2 levels today are higher than they've been in the 1930s and during the medieval warming period, but temps were higher in the 1930s and during the medieval warming period. That is a fact. This means that other factors are at play and no one disputes this.
I do.
State Temperatures | Temperature, Precipitation, and Drought | National Centers for Environmental Information (NCEI)
Maybe I just need to find the right state, but most of them show mean temperatures higher now than in the 1930s.
Or maybe the right month for the year?
Unless of course, you are cherry picking a particular year in that bouncing around to compare to 2015 (which just began summer). You wouldn't do something like that would you?
The data is available to the public. Where do you think I found it?Who knows? No one but the keepers of the data know for sure and they won't let me or anyone else see the raw data. Surely, if the data is as presented, they'd have no reason to hide it from the public.
The models make predictions, and are put to the test.Paleoclimatology is pseudo-science.
One would have to be a gullible person to believe that we can measure temperatures with any precision several hundred thousand years ago. There's an entire book written about paleoclimatology and the fraudulent practices of these clowns. Look up the work of Steve McIntyre; he's a statistician who peer-reviewed the hockey stick papers.
Excel has a fun trend line function for its scatter plots. You can do linear regression analysis and derive an R^2 coefficient from it. A perfect correlation would be a 1; no correlation or random data would be a 0. Paleoclimatology relies on correlation coefficients of less than 0.3 to make these grand pronouncements.
Paleoclimatology: Understanding the Past to Predict the Future : Feature Articles
I don't have to look up Steve McIntyre. He is the same person with the blog and an ax to grind you linked in the previous post. He hardly "peer-reviewed" the hockey stick. He has financial interests in mining, and his only involvement in climate science that climate audit blog where tracks down the particulars of station information, and cherry picks stations with issues, and uses the fact that the data is incomplete to ignore the overall trend, and similar data from many other sources. https://en.wikipedia.org/wiki/Steve_McIntyre
And no, the R^2 aren't universally 0.3. There may be some studies somewhere that have things that lack statistical power suggesting further study. It wouldn't surprise me if he cherry picked one. Maybe you can point me to it.
The data in most of the correlations I've seen are about R^2=0.8.
Look at the recent hurricane record; we're at a very slow activity period for hurricanes the past 15 years. There have been no global warming for the past 18 years. California has had droughts in the past; it's a semi-arid region.
Oh really? Now I know for sure that even our sources of facts are different. Can you tell me your sources? and explain your reasoning?
Although the violent storm issues are relatively new in terms of being processed, the temperature increases are clear. And california's current drought is worse than it has in 1200 years (http://onlinelibrary.wiley.com/doi/10.1002/2014GL062433/abstract)
I realize now that you don't believe paleoclimatology (or at least putting up a great act). But what is that you do believe? What is your reasoning?
It'd be easier if you just posted a proof of concept paper on using satellites to measure water depth. I'd be especially interested in the precision of such a technique.
We don't have to measure water depth to identify the sea level. Just the surface. The same way we build topographical maps from satellites. Here is a tutorial on Radar altimetery: http://www.altimetry.info/html/alti/principle/welcome_en.html
a paper on accuracy and resolution:
http://icesat.gsfc.nasa.gov/icesat/...Precision_and_Accuracy_of_Satellite_Radar.pdf
and a pdf of a power point lecture on it:
http://earth.eo.esa.int/dragon/ocea...DAY5-19Oct2007/D5_L1-2_letraon_lecture1_2.pdf
Since you asked: http://glims.colorado.edu/glacierdata/asterintro.php30 samples out of 198,000 is statistically irrelevant. Show me the data when they've collected data from 3,000 glaciers.
You can install a plug in in Google Earth and go at it to your heart's content. As you can with the CRUTEM data that McIntyre is supposedly having so much trouble accessing.