• You are currently viewing our forum as a guest, which gives you limited access to view most discussions and access our other features. By joining our free community, you will have access to additional post topics, communicate privately with other members (PM), view blogs, respond to polls, upload content, and access many other special features. Registration is fast, simple and absolutely free, so please join our community today! Just click here to register. You should turn your Ad Blocker off for this site or certain features may not work properly. If you have any problems with the registration process or your account login, please contact us by clicking here.

The Happiest Man in America

Vasilisa

Symbolic Herald
Joined
Feb 2, 2010
Messages
3,946
Instinctual Variant
so/sx
Discovered: The Happiest Man in America
By CATHERINE RAMPELL
March 5, 2011
New York Times

Excerpt:
For the last three years, Gallup has called 1,000 randomly selected American adults each day and asked them about their emotional status, work satisfaction, eating habits, illnesses, stress levels and other indicators of their quality of life.

It’s part of an effort to measure the components of “the good life.” The responses are plugged into a formula, called the Gallup-Healthways Well-Being Index, and then sorted by geographic area and other demographic criteria. The accompanying maps show where well-being is highest and lowest around the country.

The New York Times asked Gallup to come up with a statistical composite for the happiest person in America, based on the characteristics that most closely correlated with happiness in 2010. Men, for example, tend to be happier than women, older people are happier than middle-aged people, and so on.

Gallup’s answer: he’s a tall, Asian-American, observant Jew who is at least 65 and married, has children, lives in Hawaii, runs his own business and has a household income of more than $120,000 a year. A few phone calls later and ...
HAPPY-articleInline-v2.jpg

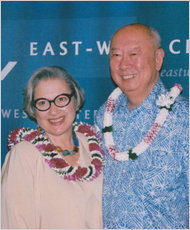
Alvin Wong and his wife, Trudy Schandler-Wong.​

<Read the full story>


This article is just silly, but I thought perhaps TypoCers might find some of the data gathered and the multimedia infographics interesting :)

 
Last edited:

MacGuffin

Permabanned
Joined
Apr 19, 2007
Messages
10,710
MBTI Type
xkcd
Enneagram
9w1
Instinctual Variant
sx/sp
Looks like it's time to move to Wyoming. Hawai`i might be a bit more difficult.
 

miss fortune

not to be trusted
Joined
Oct 4, 2007
Messages
20,589
Enneagram
827
Instinctual Variant
sp/so
My area of the state was rated happy?!? :huh:
 

mochajava

New member
Joined
Jul 28, 2010
Messages
475
MBTI Type
INFJ
The Southeast=depressed, doesn't learn. The midwest is the opposite. I'm surprised at how stark all of this is...wow, in every way you look at it, the Southeast is doing so horribly! No dentists, tons of smoking... and apparently there's a VERTICAL LINE IN THE MIDDLE OF THE COUNTRY separating those who exercise and those who don't. Wow.
 

cascadeco

New member
Joined
Oct 7, 2007
Messages
9,083
MBTI Type
INFJ
Enneagram
9w1
Instinctual Variant
sp/sx
I'm in an awesome location!!! :smile:

(honestly, you really do notice the difference, particularly health/exercise-wise, compared to farther east.)
 

guesswho

Active member
Joined
Jul 9, 2010
Messages
1,977
MBTI Type
ENTP
They asked 0.0003% of the US population if they're happy. That can't be accurate.
 

FDG

pathwise dependent
Joined
Aug 13, 2007
Messages
5,903
MBTI Type
ENTJ
Enneagram
7w8
Gallup’s answer: he’s a tall, Asian-American, observant Jew who is at least 65 and married, has children, lives in Hawaii, runs his own business and has a household income of more than $120,000 a year. A few phone calls later and ...

Well, this statistical analysis reaches a rather obvious conclusion: since those traits tend to be highly uncorrelated (tall+ asian american + observant jew + lives in hawaii? Their conditional probability must be almost zero), extremely happy people are extremely rare. Lies, damn lies and statistics, indeed :huh:
 

InvisibleJim

Permabanned
Joined
Nov 19, 2009
Messages
2,387
Well, this statistical analysis reaches a rather obvious conclusion: since those traits tend to be highly uncorrelated (tall+ asian american + observant jew + lives in hawaii? Their conditional probability must be almost zero), extremely happy people are extremely rare. Lies, damn lies and statistics, indeed :huh:

But... if you are a tall asian american now you know the formula to use to maximise your potential happiness!

:rofl1:
 

BlueGray

New member
Joined
Oct 7, 2009
Messages
474
MBTI Type
INTP
Enneagram
5
They asked 0.0003% of the US population if they're happy. That can't be accurate.

http://en.wikipedia.org/wiki/Sample_size

As long as you sample only a small percentage of the population, population size doesn't influence accuracy. A sample of 4000 people out of 1000000 is not noticeably more accurate than a sample of 4000 people out of 1000000000.

If your sample is 4000 out of 6000 than this obviously doesn't apply. This is due to it being impossible to have values like 100% happy if only 50% of people are happy. It's only when hard limits start to be set by the sampling that it gains accuracy due to population size.

So, Massachusetts doesn't stand out much except on overall and health insurance. Big surprise that mandatory health insurance puts you on top of health insurance percentage.
 

Octarine

The Eighth Colour
Joined
Oct 14, 2007
Messages
1,351
MBTI Type
Aeon
Enneagram
10w
Instinctual Variant
so
They asked 0.0003% of the US population if they're happy. That can't be accurate.

Yes, I daresay there is huge uncertainty in the data.

The part I object to though, is the idea that a transient questionnaire can validly measure ones happiness over time.

BlueGray - it is true that precision is not the same as accuracy. But 'significant' confidence interval cutoffs themselves are simply arbitrary. If you sample only 4000 people from a very large group, the chance of the data being unrepresentative is always higher than if you use a larger sample.
 

Rail Tracer

Freaking Ratchet
Joined
Jun 29, 2010
Messages
3,031
Instinctual Variant
sx/so
My place isn't so bad :D. Or actually, the 4 districts that encompass my city are doing pretty good. I think doing this in different cities/county borders would at least be a slightly better idea instead of through districts. Huge swatches of land like Montana and North Dakota don't really say much.

What I found interesting are the statics on inadequate food, inadequate shelter, diabetes, obesity, high cholesterol, smoking and exercise. Like how the scores here for diabetes and obesity can easily relate to the one done with cdc.

It is nice to see how people view their own area though. Kind of nice knowing that some districts view their work environment, job satisfaction, and community improvement on such nice standards.
 
Top